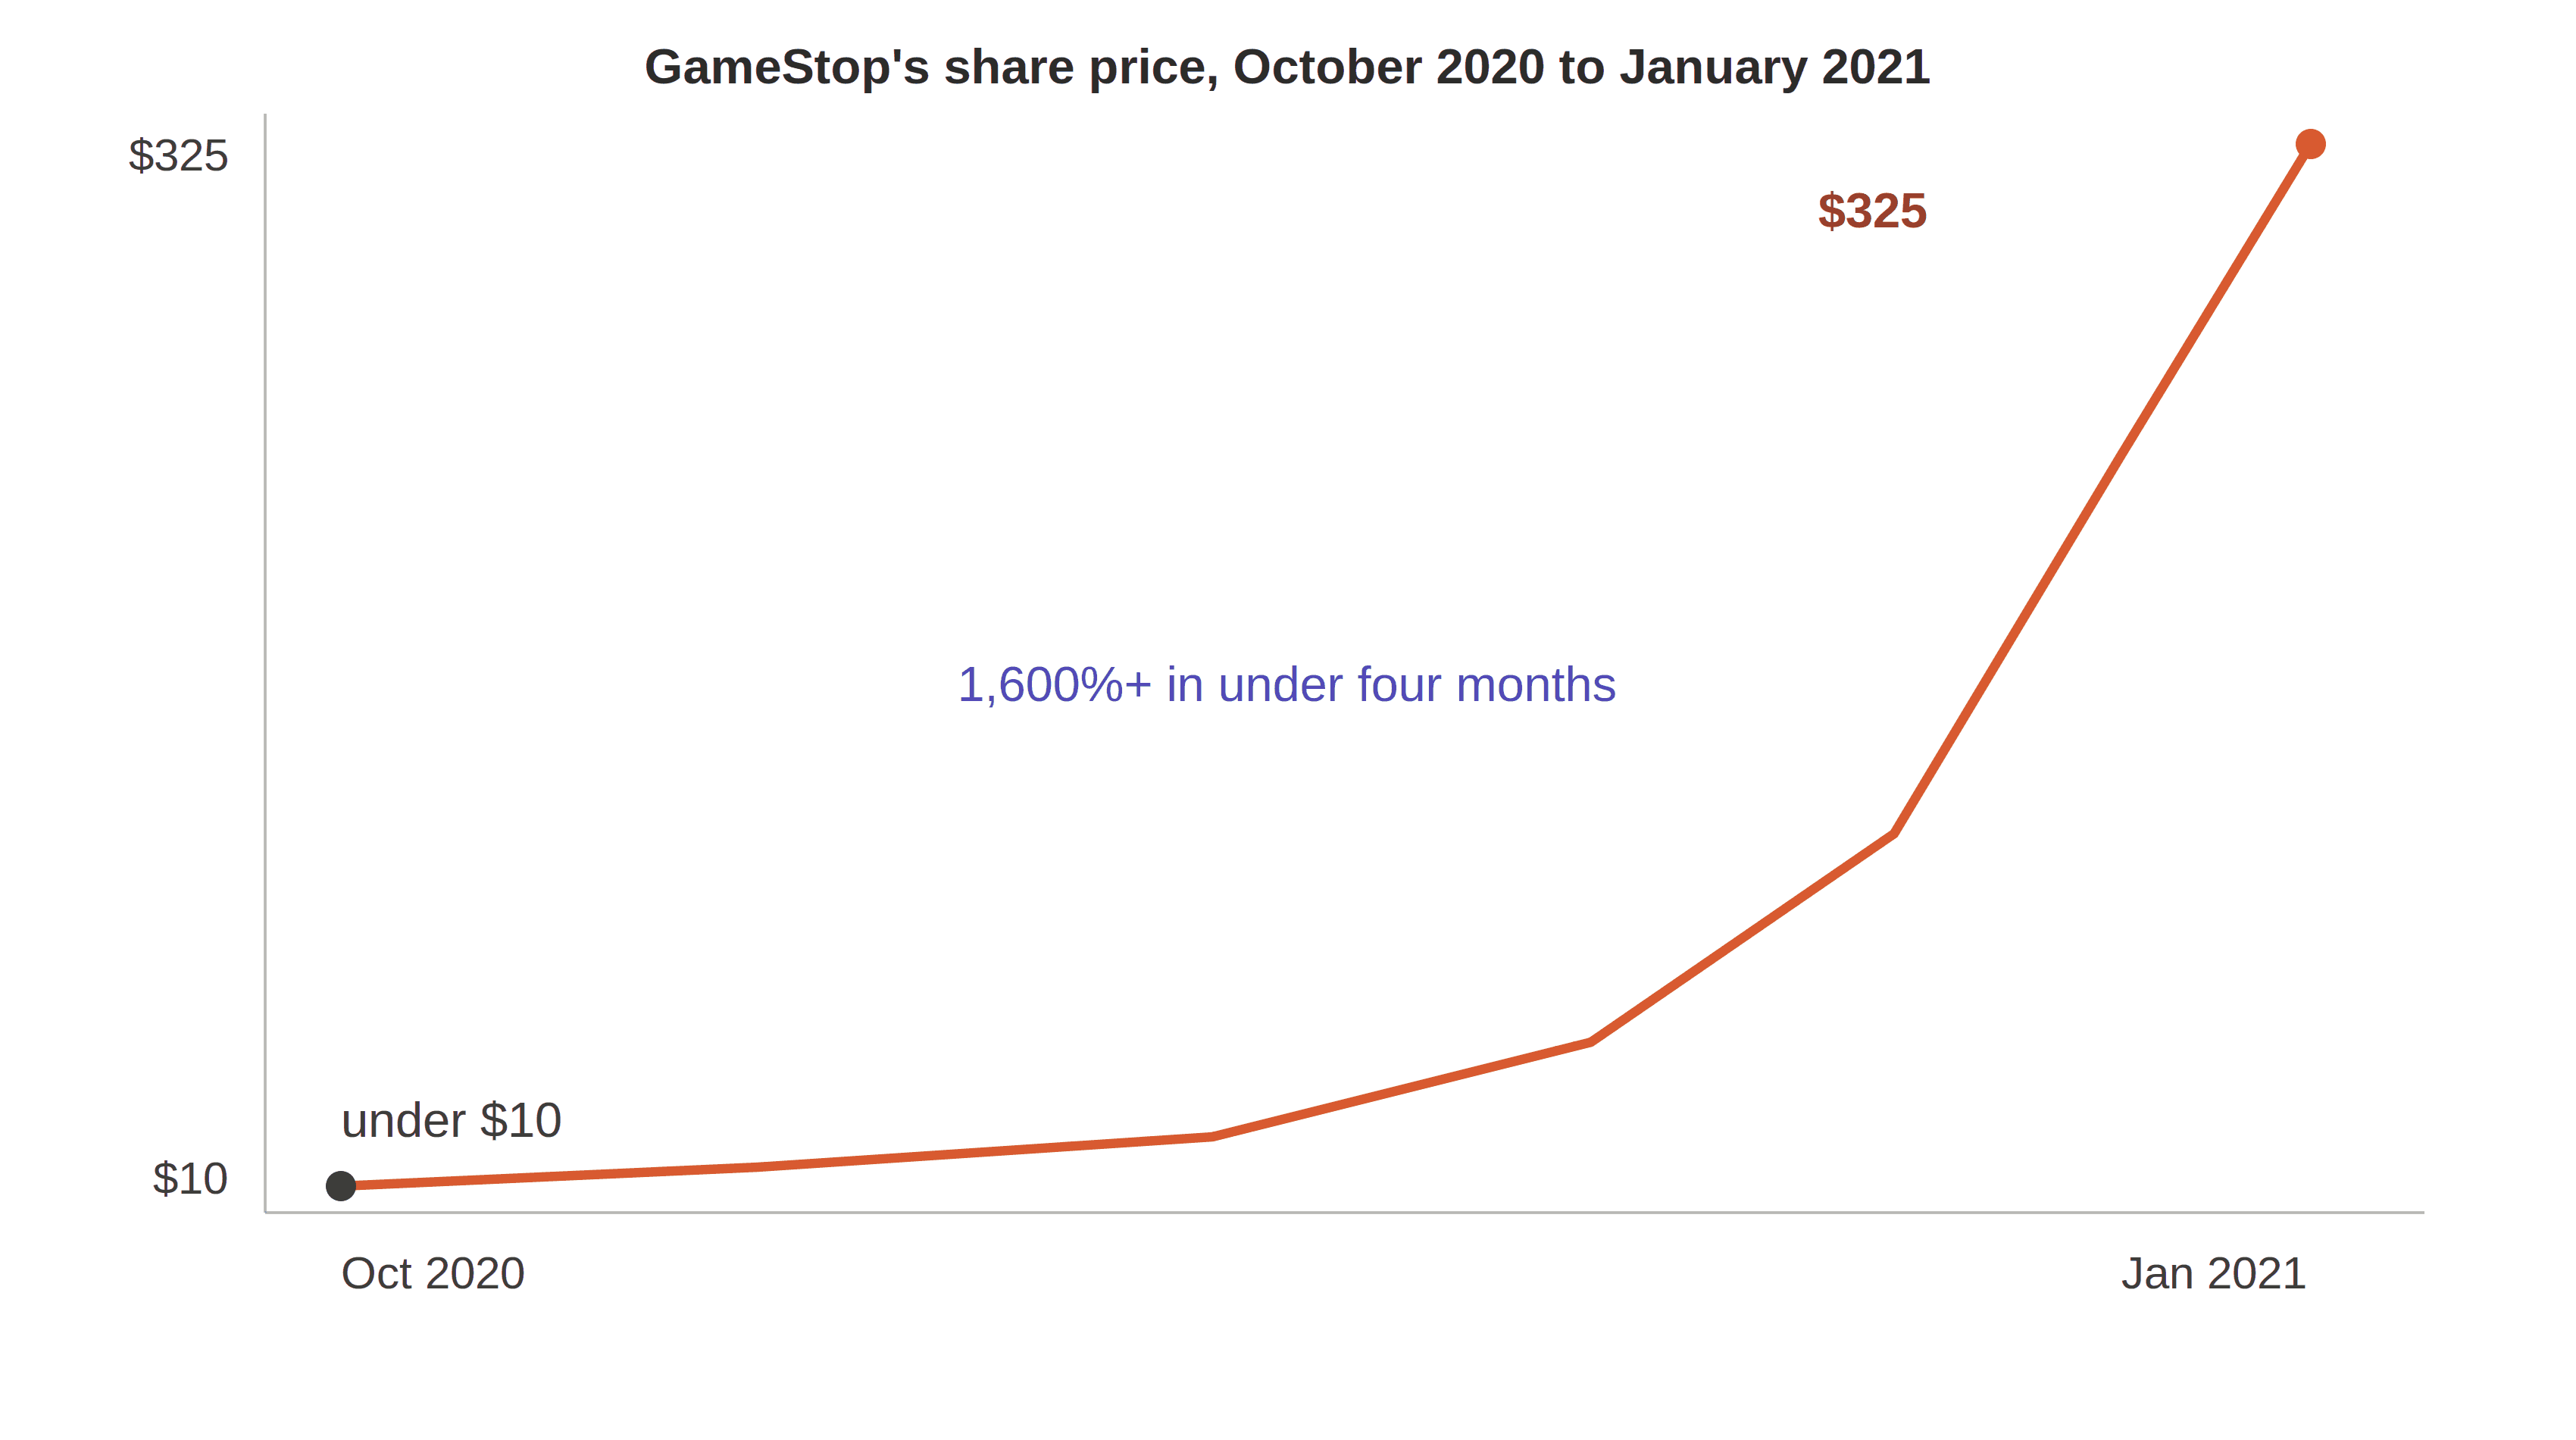
In October 2020, shares of a struggling video game retailer traded under ten dollars. By the last week of January 2021, the same stock closed at $325, a gain of over 1,600 percent in under four months. It didn't just move in price. From January 13 onward, GameStop traded a daily average of 118 percent of its entire public float, more shares changing hands each day than technically existed to trade, and on several days that figure exceeded 300 percent. A hedge fund that had bet against the stock lost 53 percent of its assets in January and needed a $2.75 billion emergency infusion just to survive. It shut down within the year.
The last article in this series ended with a promise, not a vague gesture at "markets," but five things named directly: that loss aversion and regret avoidance would show up in real brokerage data, that overconfidence would turn up priced into real portfolio returns, that noise trader risk and the limits of arbitrage would explain why biased markets don't simply get corrected, and that informational cascades would show individually reasonable people building a collectively wrong herd. That promise turns out to have been narrower than it needed to be even once kept.
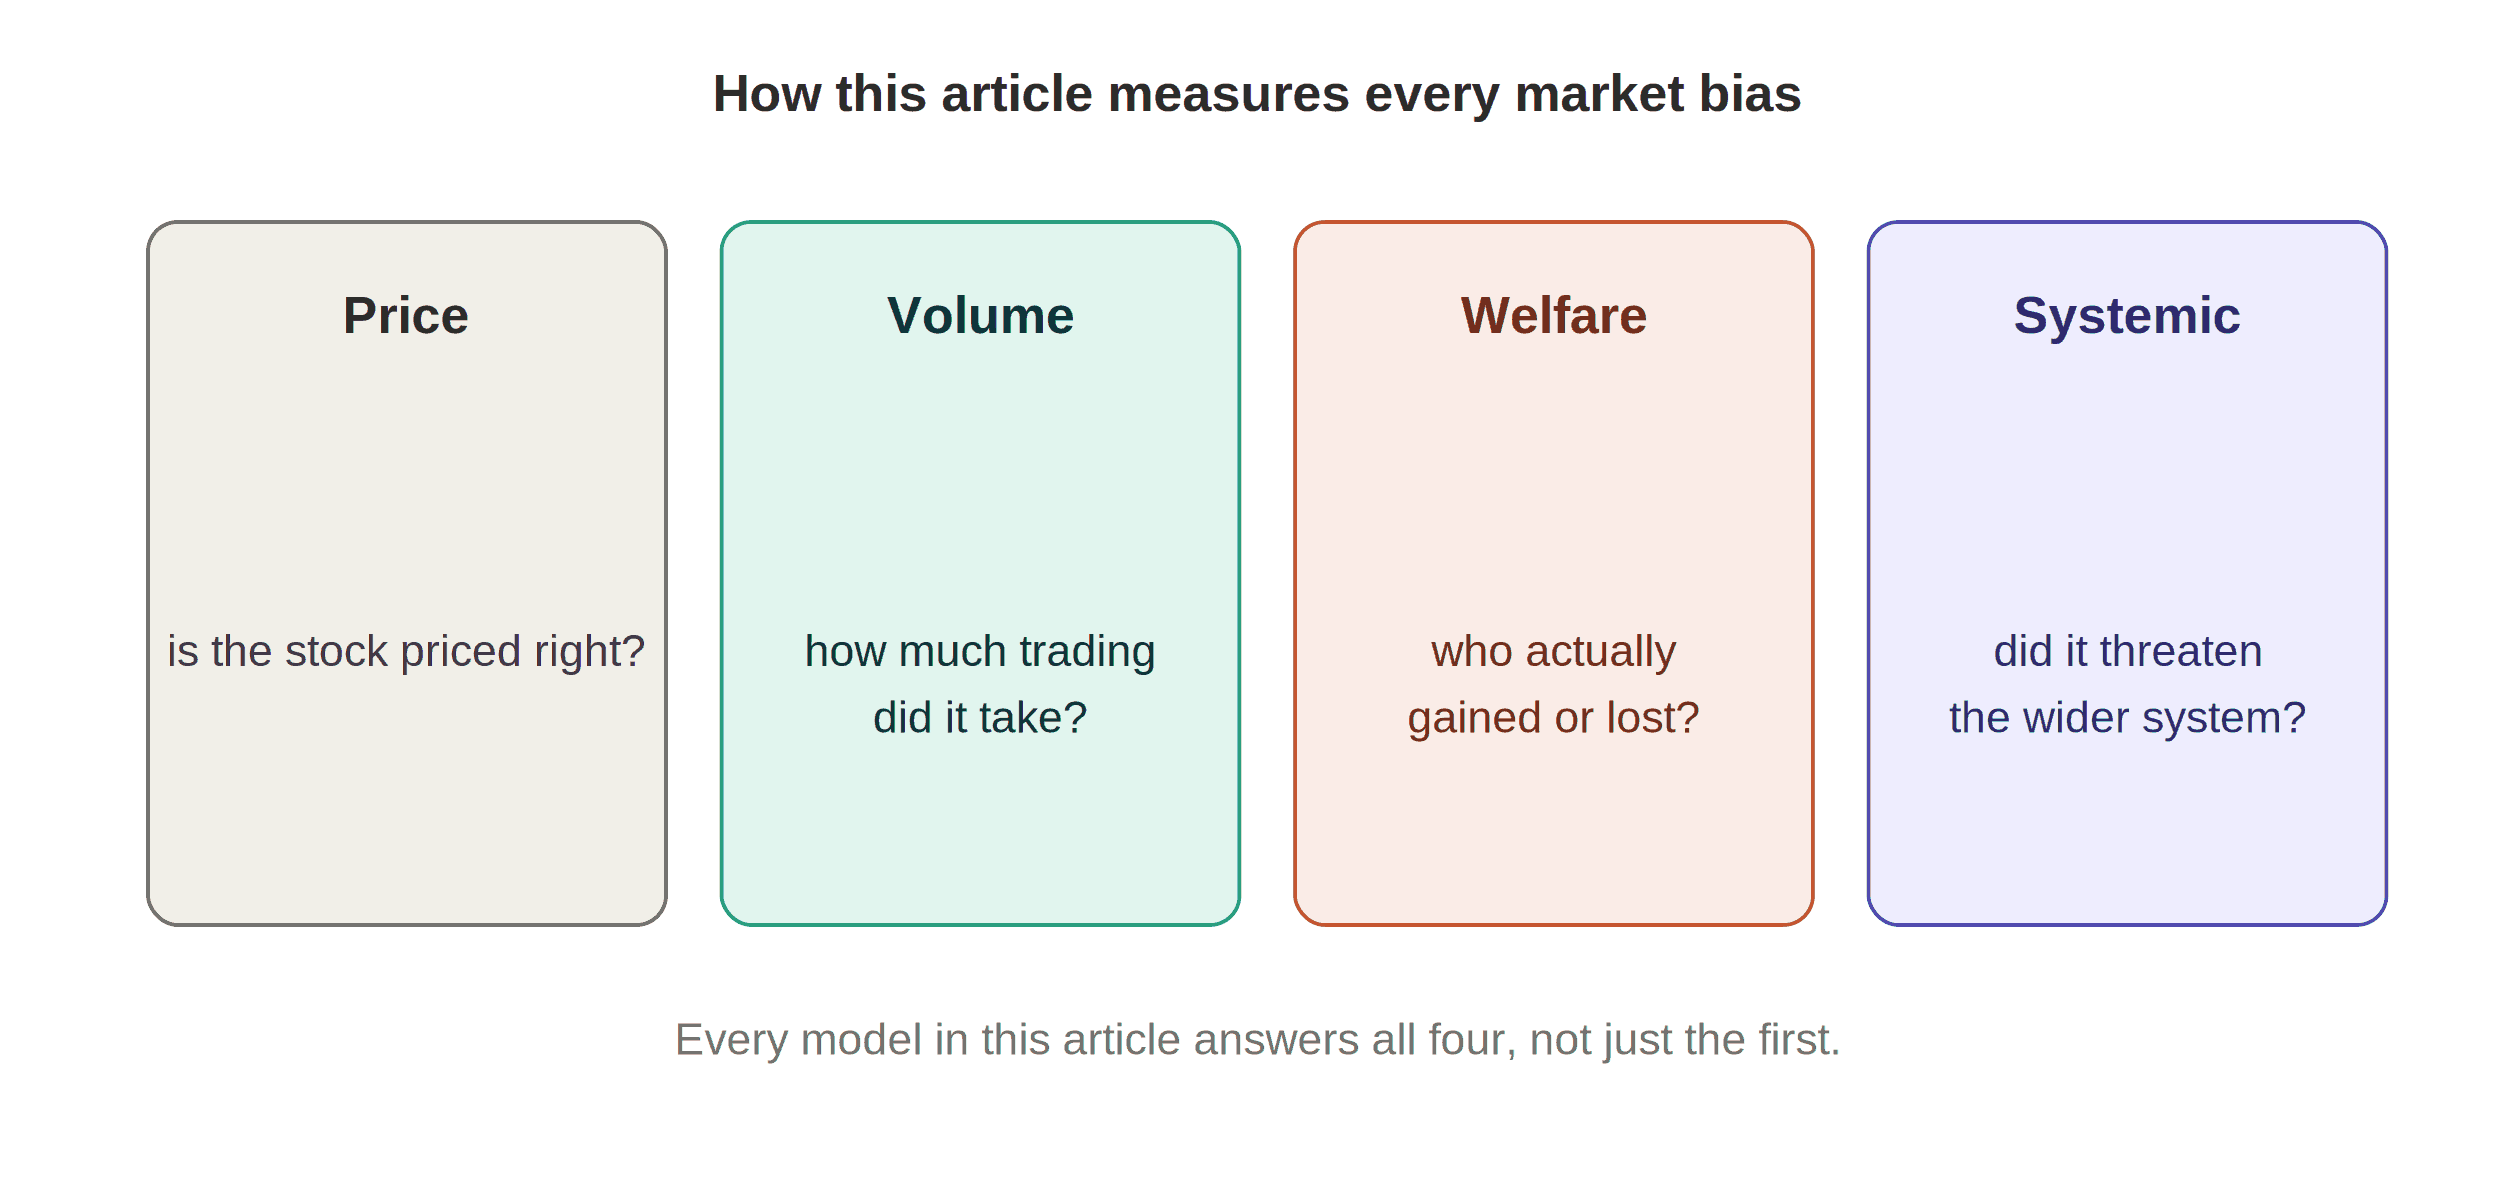
A price is the most visible output of a market, but it is not the only one. The same trade that sets a price also generates volume, how much actual buying and selling had to happen to get there. It also generates welfare consequences, someone's gain is frequently someone else's measurable loss, not an abstraction. And past a certain scale, it generates systemic risk, consequences that spill past the two parties to the trade entirely. This article keeps the original promise and treats all four, price, volume, welfare, and systemic risk, as equally real outputs of the same underlying psychology, in every section that follows, not as a price story with three footnotes.
Eight formal models, several already introduced across this series in a purely individual or interpersonal context, do that work.
Where the Efficient Market Hypothesis Stops Explaining Markets
| Gap in the Efficient Market Hypothesis | Which Model Closes It |
|---|---|
| Assumes an investor treats a stock's future prospects the same way regardless of whether they're currently up or down on it | The Disposition Effect |
| Assumes trading reflects genuine informational advantage, not simply overestimating one's own skill, and says nothing about why trading volume itself exists at the scale it does | Overconfidence in Trading |
| Assumes prices adjust to new information correctly and immediately, neither too slowly nor too dramatically | Momentum and Under/Overreaction |
| Assumes the market-wide price of risk is set by observable risk aversion, not by how often investors check their own portfolios | The Equity Premium Puzzle |
| Assumes irrational traders simply get arbitraged away rather than creating a new risk of their own | Noise Trader Risk |
| Assumes rational arbitrage is costless, unconstrained, and can outlast any temporary mispricing | The Limits of Arbitrage |
| Assumes each trader's decision reflects that trader's own information, not simply a copy of whoever traded before them | Informational Cascades |
| Assumes a professional manager's incentive is always to be right, never simply to avoid being wrong alone | Reputational Herding |
What Is the Disposition Effect?
The mechanism. Hersh Shefrin and Meir Statman's 1985 paper named a pattern that shows up almost everywhere real trading data has been examined since: investors sell stocks that have risen in value considerably sooner than they sell stocks that have fallen, holding the losers far longer than any tax or portfolio-rebalancing logic would justify.
The formal model. The mechanism follows directly from prospect theory's value function, applied to a stock relative to its own purchase price as the reference point:
| Term | Meaning |
|---|---|
| The investor's utility from the position, the quantity actually driving the decision to sell or hold | |
| The stock's current value | |
| The investor's reference point, in practice almost always the original purchase price | |
| Prospect theory's value function: concave for gains above the reference point, convex for losses below it |
For a stock currently above purchase price, the investor is risk-averse, preferring a certain gain over a larger uncertain one, which means selling. For a stock currently below purchase price, the investor is risk-seeking, preferring the gamble of recovery over a certain loss, which means holding.
Worked example. Using for gains and for losses: a stock bought at ₹100, now at ₹150, facing a symmetric 50/50 gamble, selling locks in against a holding expected value of , selling wins. The identical stock now at ₹70 instead: selling locks in against a holding expected value of , holding wins. Same symmetric gamble, opposite preferred action, purely from which side of the purchase price the position sits on.
Regret theory adds a second layer, selling a loser locks in the regret of having bought it, and holding defers that confrontation indefinitely. Kőszegi and Rabin's expectations-based reference point explains where the purchase price itself comes from as a psychologically meaningful anchor. O'Donoghue and Rabin's naive present bias shows up in the investor who tells themselves they'll sell "once it recovers a little," a plan that keeps getting made and keeps getting broken.
Volume: an asymmetry, not just a returns story. The disposition effect doesn't just bias which stocks get sold, it biases how much trading happens in winners versus losers. Winning positions see disproportionately high turnover, sold quickly and often; losing positions see turnover freeze, held long past the point a rebalancing-only investor would have moved on. Mark Grinblatt and Bing Han's 2005 paper, "Prospect Theory, Mental Accounting, and Momentum," formalizes this directly, showing that the population of investors still holding unrealized gains versus unrealized losses on a given stock, what they call the "capital gains overhang," predicts trading volume and, through it, future price momentum, connecting this article's first two dimensions, price and volume, through a single behavioral mechanism.
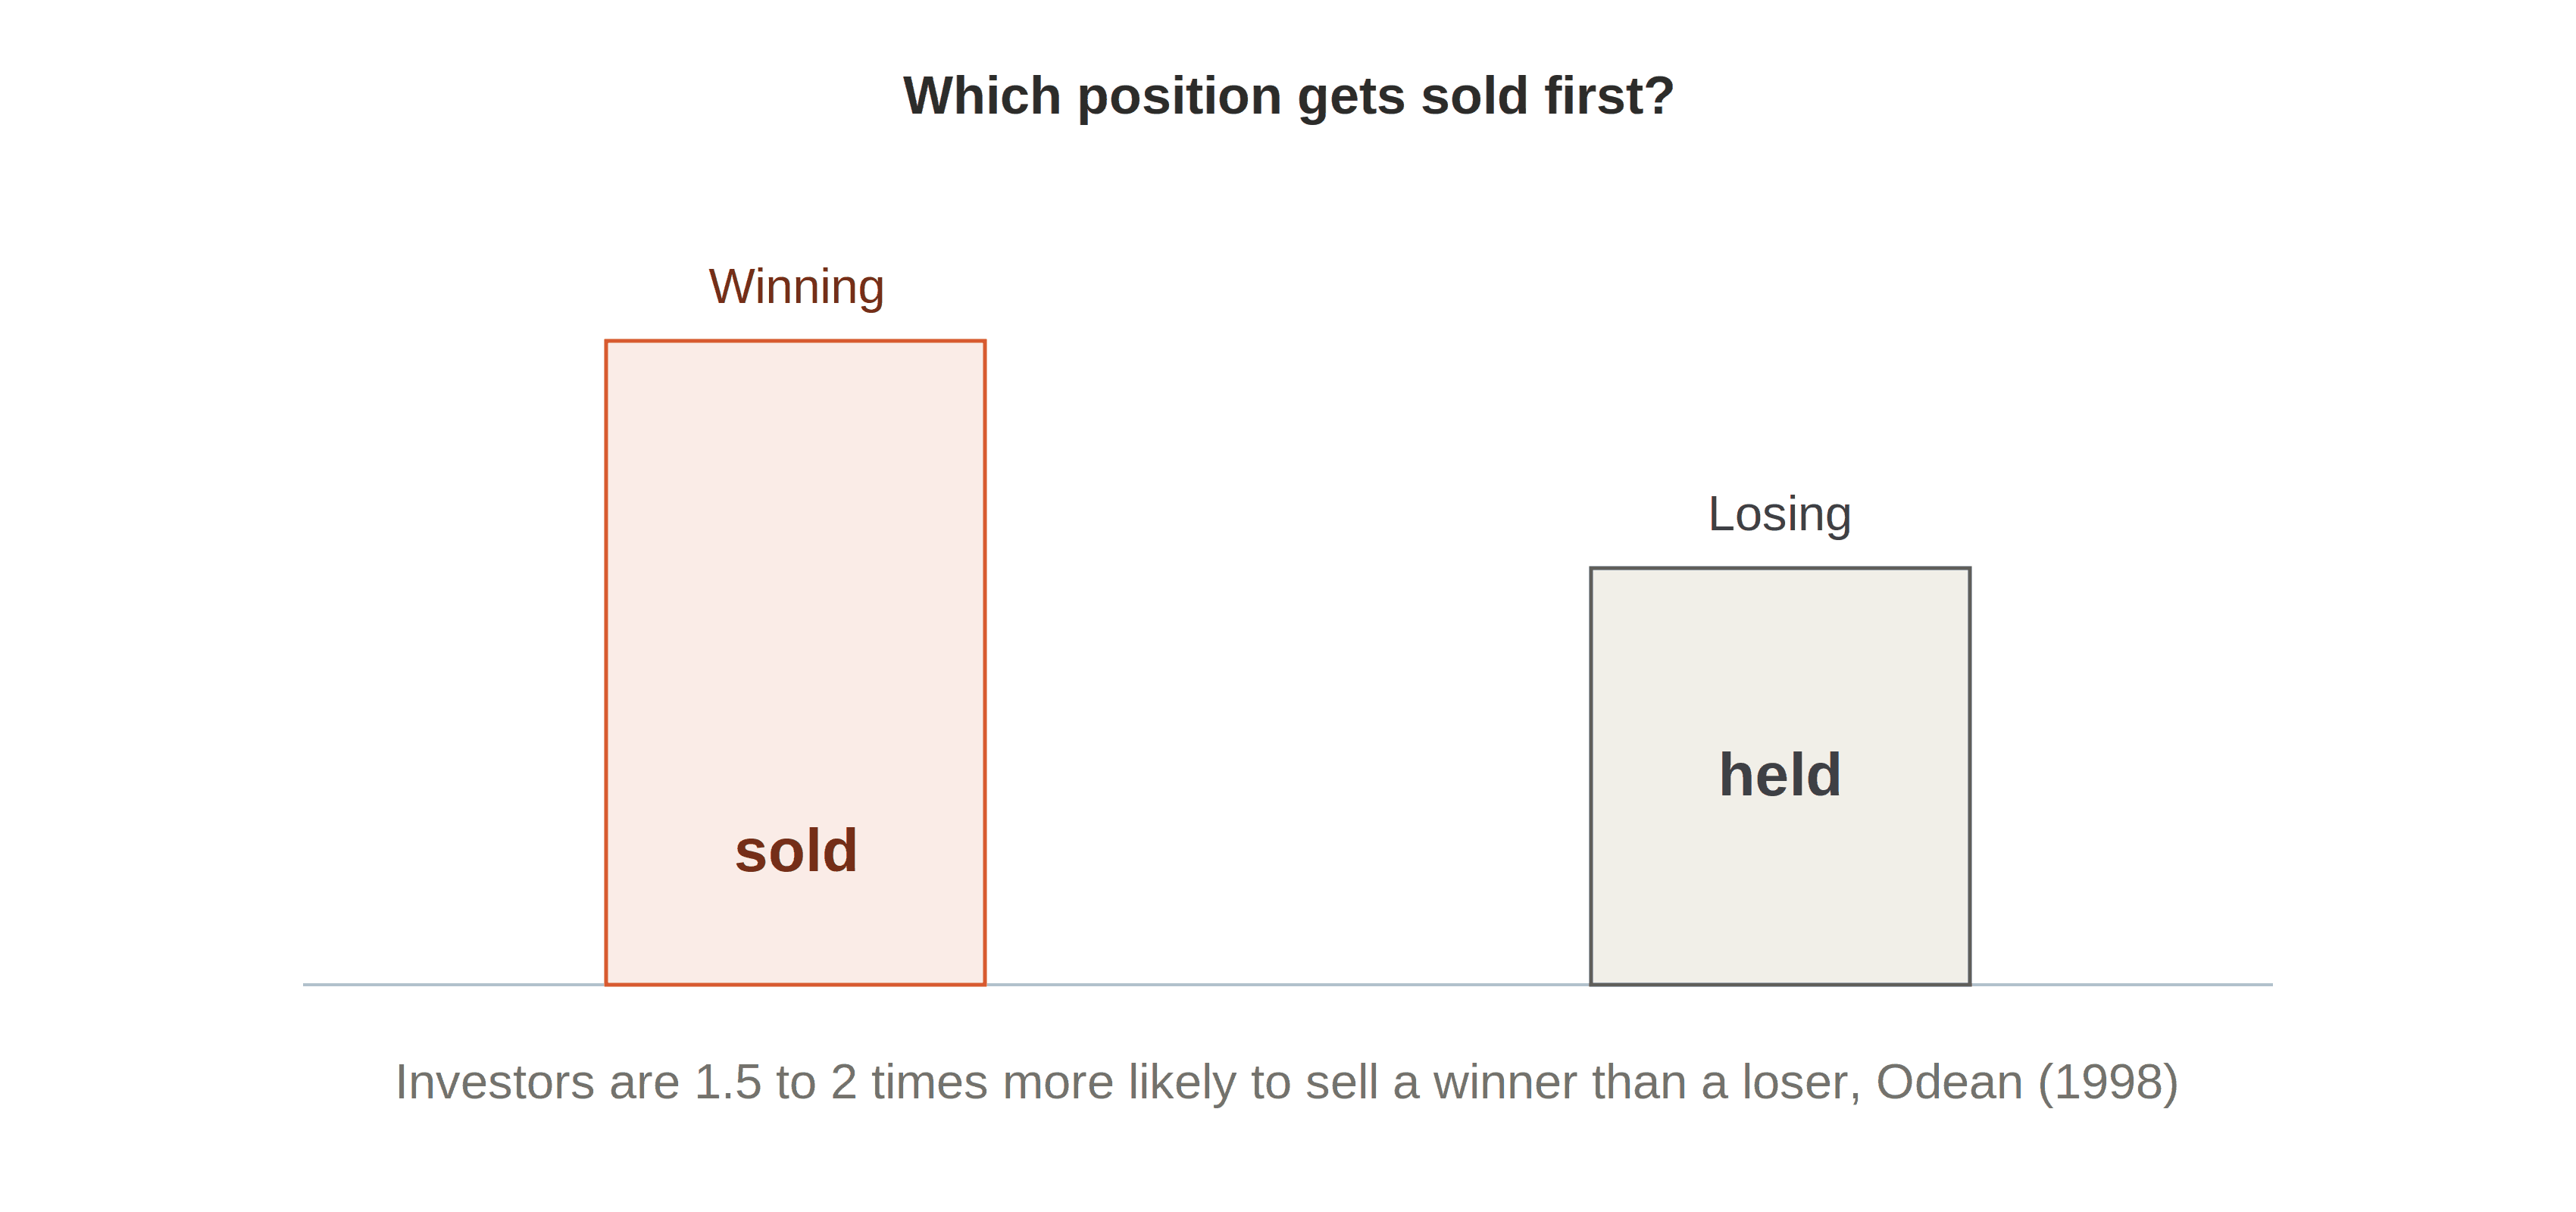
Welfare: a quantified, not hypothetical, cost. Terrance Odean's 1998 study of 10,000 real discount-brokerage accounts found investors 1.5 to 2 times more likely to sell a winning position than a losing one, a pattern immune to every alternative explanation Odean tested, including US tax rules, which actually favor realizing losses, not gains.
Odean's own data found the pattern was not justified by subsequent performance: the winners investors rushed to sell went on, on average, to keep outperforming the losers they held. This is a real, measured transfer of expected return away from the investor exhibiting the bias, not a harmless quirk of temperament.
Systemic: an overhang that concentrates exactly when liquidity matters most. Because the disposition effect suppresses selling specifically among investors sitting on losses, it means retail selling pressure is systematically withheld during and immediately after market downturns, precisely the moments a market benefits most from orderly, liquid two-sided trading. A market full of disposition-effect-driven holders doesn't just misprice individual stocks, it can thin out exactly the liquidity a stressed market needs, an aggregate consequence of millions of individually unsurprising decisions to keep holding.
Chapter 3Overconfidence in Trading: Price, Volume, Welfare, and Market-Wide Consequences All at Once
The mechanism. Every trade carries a transaction cost, and trading is only worth that cost if the trader genuinely knows something the market doesn't. Brad Barber and Terrance Odean's 2001 paper, "Boys Will Be Boys," used the well-documented gender gap in overconfidence as a natural experiment: if overconfidence drives excess trading, the more overconfident group should trade more and earn less.
The formal model.
| Term | Meaning |
|---|---|
| The trader's expected net benefit from their trading activity | |
| Expected trading profit, calculated using the trader's own believed signal precision , not the true precision | |
| The transaction cost per trade | |
| The number of trades made |
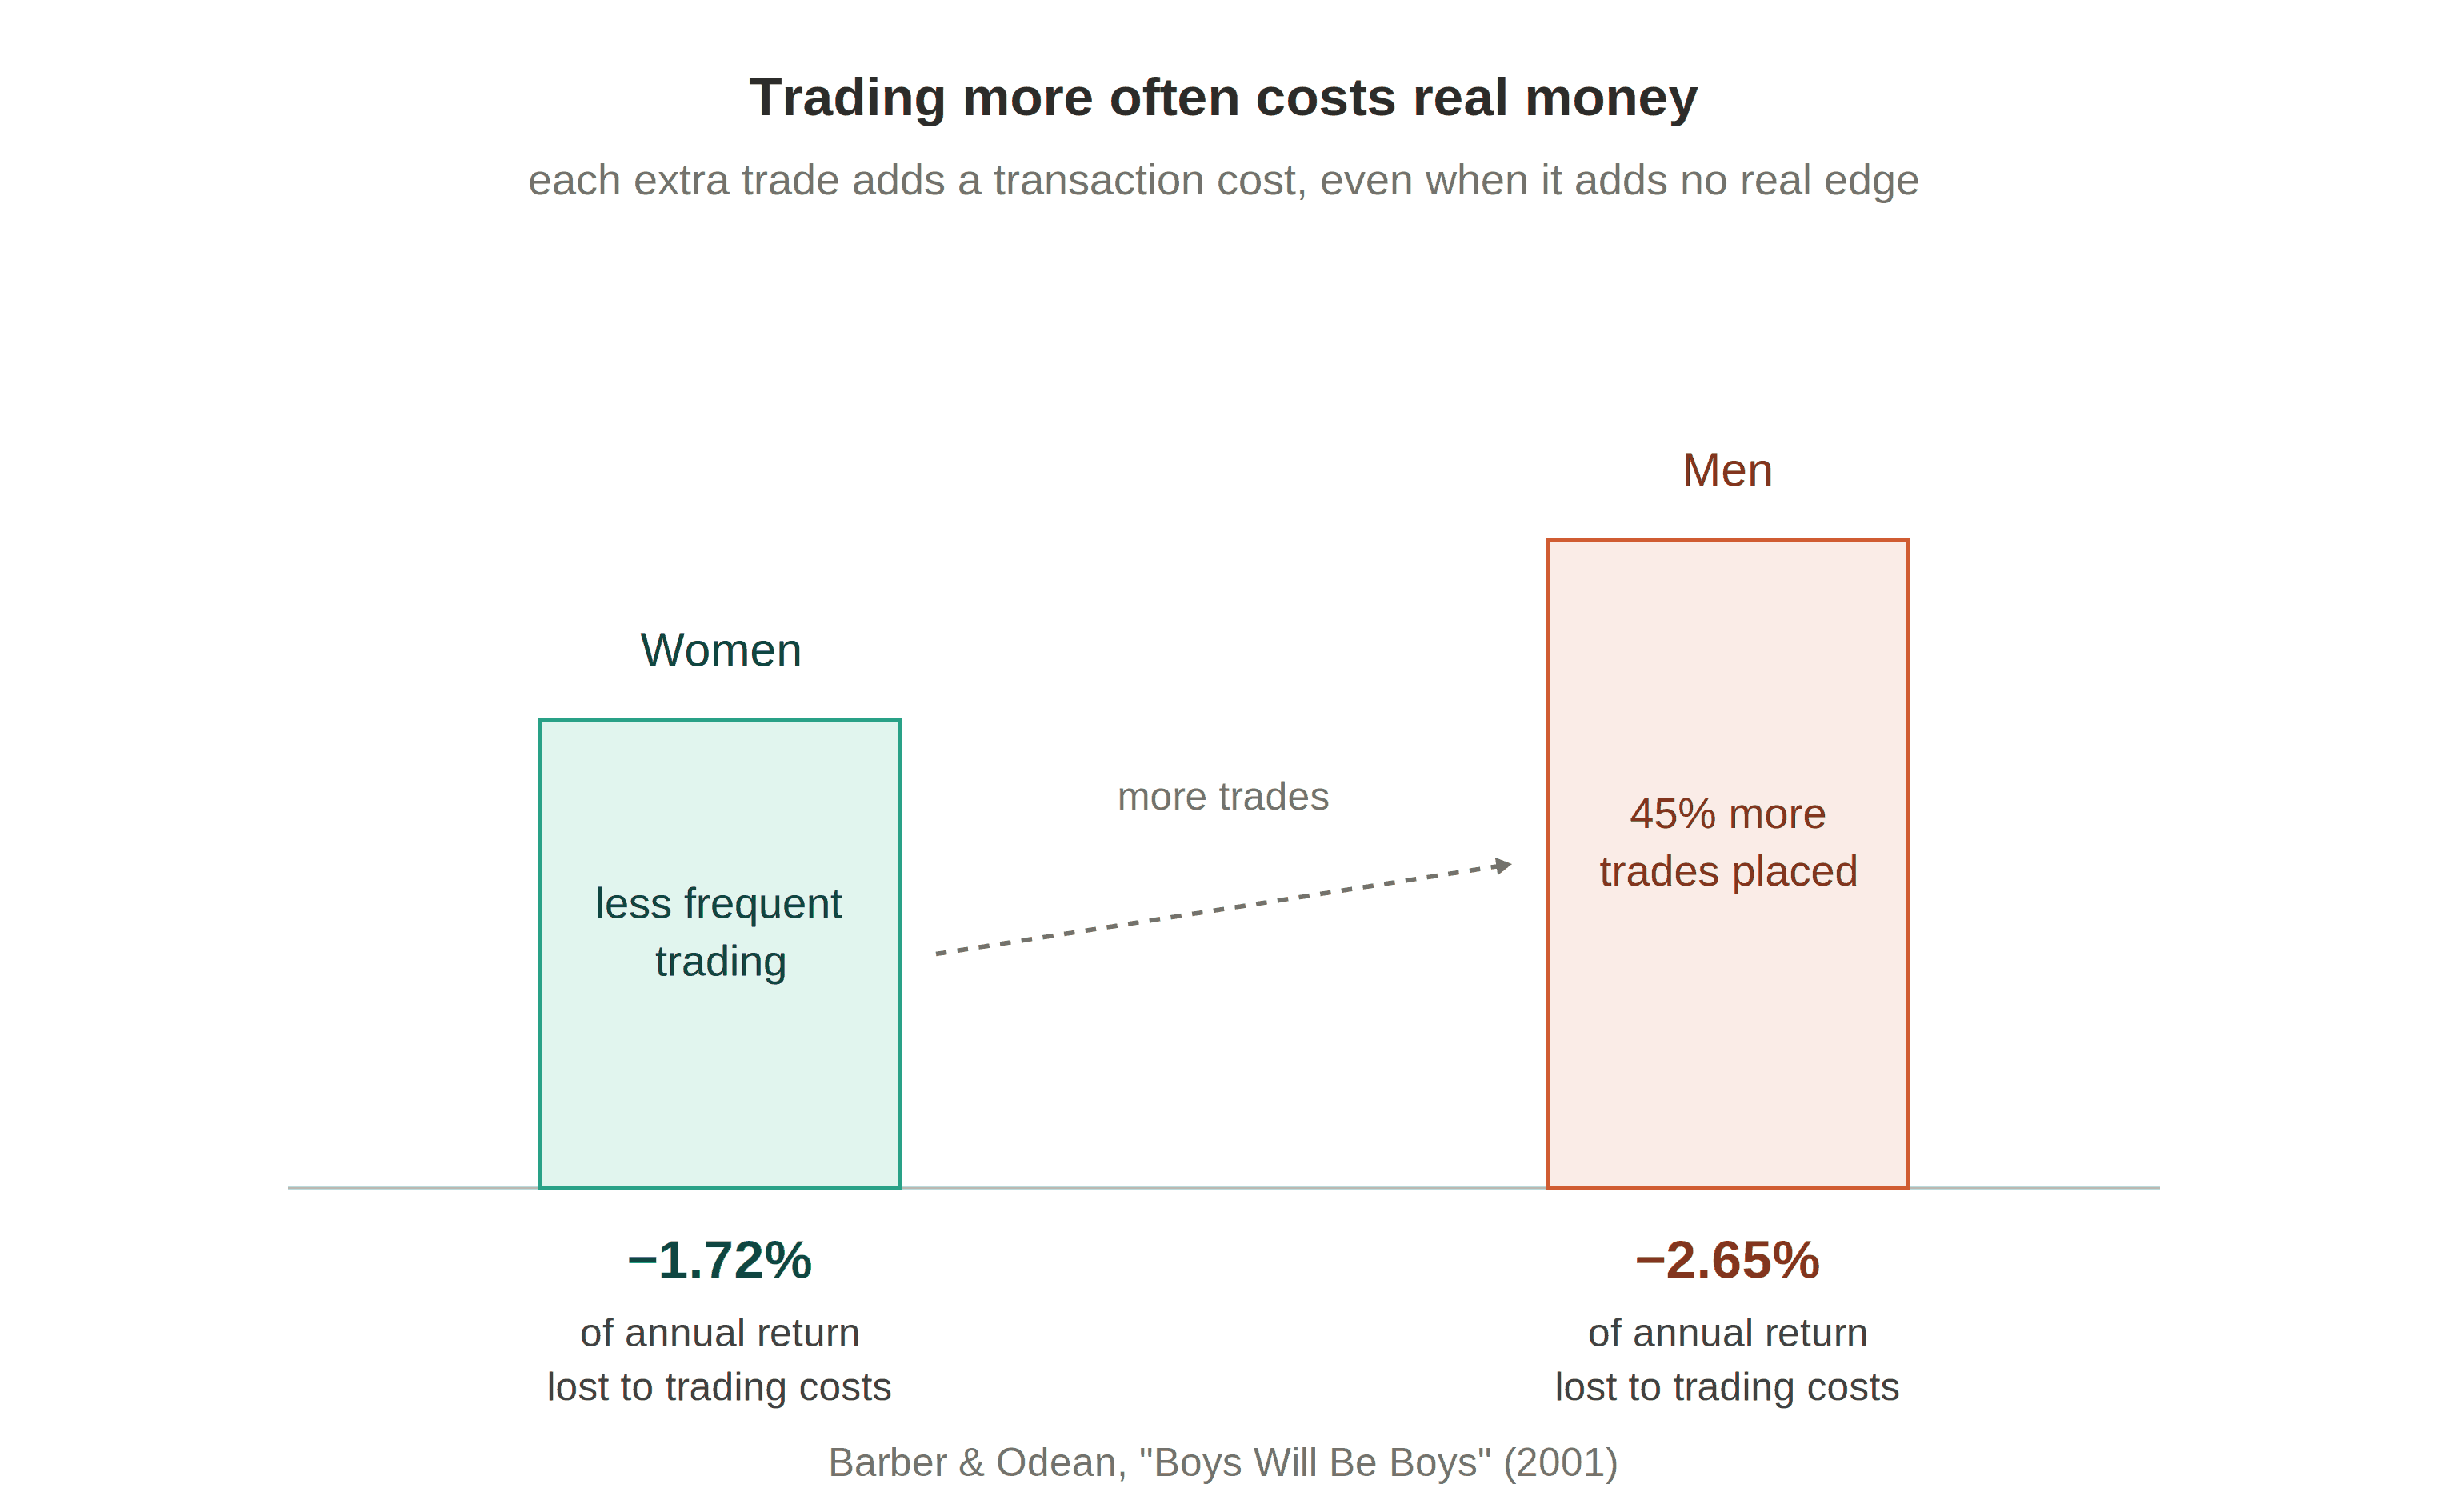
Welfare, first. Men traded 45 percent more than women, single men 67 percent more than single women, and that extra trading cut men's net annual returns by 2.65 percentage points against women's 1.72, a nearly one-point annual gap compounding over a multi-decade investing horizon into a substantial share of an entire retirement's worth of returns, paid to the market's cost structure and to whoever wasn't on the losing side of the same overconfident trades.
Volume is not a side effect here, it's the headline finding. Odean's own 1998 paper, "Volume, Volatility, Price, and Profit When All Traders Are Above Average," studies trading volume directly, not as a byproduct of the returns story, and finds overconfidence reliably increases expected trading volume across every market structure tested, a result Odean himself calls the single most robust effect overconfidence produces. Statman, Thorley, and Vorkink's 2006 study tested this prediction against real market data directly and confirmed it. The same paper closes a loop back to this series' first article: markets underreact to abstract, statistical information while overreacting to salient, anecdotal information, precisely the mechanism Bordalo, Gennaioli, and Shleifer's salience theory describes.
Systemic: who is overconfident changes what breaks. Odean's model is explicit that overconfidence's effect on market-wide volatility and price quality depends on who holds it, ordinary price-taking traders, a strategic informed insider, or the market-makers providing liquidity to everyone else. Overconfident market-makers, specifically, can degrade the quality of prices for the entire market they're intermediating, not just their own portfolio, a genuinely systemic channel distinct from any individual trader's personal losses.
This overconfidence carries the planning fallacy inside it, systematic overoptimism about how quickly a thesis will resolve, feeding directly back into trading frequency. And the modern trading app, real-time alerts, one-tap execution, is Gul and Pesendorfer's temptation sitting on a lock screen, imposing a self-control cost merely by being present.
Where this shows up in practice. Related work found households that traded the most, regardless of who was trading, earned the lowest net returns in the sample, a direct, monotonic relationship between volume and underperformance.
Momentum: A Price Pattern With Its Own Volume Signature and Its Own Losers
The mechanism. A stock's recent past returns shouldn't predict its future returns at all under efficient pricing. Real markets show momentum, recent winners keep winning, recent losers keep losing, for a period, before eventually reversing. Kent Daniel, David Hirshleifer, and Avanidhar Subrahmanyam's 1998 paper traced this to overconfidence about one's own private information combined with biased self-attribution, crediting skill for wins and luck for losses, which asymmetrically inflates confidence after a payoff and pushes prices further in the same direction. Nicholas Barberis, Andrei Shleifer, and Robert Vishny's 1998 companion model derives a similar pattern from conservatism and representativeness instead, two different psychological starting points converging on the same empirical prediction.
Volume doesn't just accompany momentum, it predicts its strength and duration. Charles Lee and Bhaskaran Swaminathan's 2000 paper, "Price Momentum and Trading Volume," found that past trading volume itself forecasts both how large a momentum effect will be and how long it will last, high-turnover winners see faster subsequent reversals than low-turnover winners, and high-turnover losers recover faster than low-turnover losers. Volume isn't a side detail here, it's the variable that tells you which momentum patterns are about to break and which will persist.
Welfare: momentum strategies are profitable for someone, which means unprofitable for someone else. Every dollar a momentum trader captures buying recent winners came from someone who sold too early, and every dollar captured shorting recent losers came from someone who bought too late or held too long, frequently the same overconfident, high-turnover traders described earlier in this article, the population least equipped to be on the correct side of a systematic pattern this well documented.
Systemic: the crowded-trade risk this article has already seen once. When a strategy this well known, buy recent winners, sell recent losers, gets adopted at scale by many funds simultaneously, it creates exactly the kind of correlated positioning that makes an eventual unwind dangerous rather than orderly, the same crowded-trade mechanism that made LTCM's convergence trades systemically fragile rather than merely risky, applied here to momentum instead of arbitrage.
Where this shows up in practice. Momentum-based strategies have been documented as profitable over three-to-twelve month horizons across most major equity markets studied, a direct, tradeable signature efficient-market theory says shouldn't exist.
Chapter 5The Equity Premium Puzzle: Price, Volume, and Welfare at the Scale of an Entire Portfolio
The mechanism. Every model so far addresses whether one stock's price is right. Rajnish Mehra and Edward Prescott documented a market-wide puzzle in 1985: stocks have outperformed bonds by a margin so large that standard models can only explain it with implausible risk aversion. Shlomo Benartzi and Richard Thaler's 1995 resolution combines loss aversion with evaluation frequency, how often an investor checks the scoreboard.
The formal logic.
| Term | Meaning |
|---|---|
| The investor's perceived utility from holding stocks | |
| Prospect theory's loss-averse value function | |
| The portfolio's return, measured over an evaluation window of length | |
| How often the investor mentally checks performance |
Checked daily, a portfolio shows a loss on close to half of all days, each stinging roughly twice as hard as an equivalent gain feels good. Checked yearly, losses register far less often, and loss aversion barely engages.
Worked illustration. The historical equity premium's size matches prospect theory's own parameters almost exactly at a roughly one-year evaluation horizon, meaning investors behave as though re-deciding whether stocks are worth the pain annually, even when their actual goals were decades away.
Volume: checking often and trading often aren't independent habits. An investor mentally re-evaluating their portfolio every year, or every quarter, or, increasingly, every time an app sends a price notification, isn't just suffering more loss-aversion pain, they're also generating more opportunities to act on that pain, selling into a bad month, chasing a good one. The same short evaluation window driving the equity premium puzzle is a direct input into trading frequency, tying this model back to the volume dynamics already established in overconfidence and momentum.
Welfare: the cost of demanding too large a premium. An investor who requires an inflated return to hold stocks, because they're implicitly evaluating on a one-year horizon rather than their true multi-decade one, systematically underweights equities relative to what their actual risk tolerance and time horizon would rationally support. That's a real, individual welfare cost, forgone long-run return, paid for psychological comfort on a timescale the investor's own stated goals never required.
Systemic: a whole economy's capital allocation, not just one portfolio's. If this pattern holds broadly across an investor population, and Benartzi and Thaler's evidence suggests it does, the aggregate consequence is an economy-wide tilt toward safer, lower-return assets than collective long-run goals would actually justify, a genuine, if diffuse, misallocation of capital away from productive risk-bearing at the scale of the whole market, not any single investor's mistake.
Where this shows up in practice. Retirement-plan design has taken this seriously: sending account statements less frequently is a documented, deliberate intervention aimed at closing exactly this mismatch.
Chapter 6Noise Trader Risk: Why Being Right Isn't Enough, Measured in Price, Volume, and Wealth
The mechanism. If irrational traders push a price away from value, rational traders should profit by betting against them, correcting the price. J. Bradford De Long, Andrei Shleifer, Lawrence Summers, and Robert Waldmann's 1990 paper shows why this doesn't reliably happen: the rational trader is betting on surviving long enough for the correction to arrive, and irrational traders' beliefs can become more wrong before they become less wrong, a genuine, undiversifiable risk.
Worked example. A stock's true value is ₹100, but noise trader pessimism has pushed the current price to ₹90, an apparently easy ₹10 profit for anyone buying now and waiting for the price to correct. Suppose the arbitrageur is capital-constrained and must exit in exactly one period, and noise trader sentiment can go either way from here: a 50 percent chance it recovers fully to ₹100 (profit of ₹10), and a 50 percent chance noise traders get more pessimistic first, pushing the price to ₹70 before any correction (loss of ₹20).
The expected payoff is negative, five rupees lost on average, despite the arbitrageur being completely correct that the stock is worth ₹100. Being right about the destination doesn't help if noise trader risk means the road there runs through a bigger loss than the trader can survive.
Price and volume, both extreme, both measured. A hedge fund's bet against a stock is a short position, borrowing shares to sell immediately, with a plan to buy them back later, ideally at a lower price, and return them; the difference is the profit, or, if the price rises instead, the loss. GameStop wasn't a random target for this kind of bet. Among hundreds of heavily shorted stocks, it became salient because its short interest, the total shares sold short and not yet bought back, exceeded its entire available float, the actual number of shares free to trade in public hands at all, Bordalo, Gennaioli, and Shleifer's salience mechanism operating on a market of traders comparing hundreds of candidates.
The volume that followed wasn't incidental to the price move, it was the price move's actual mechanism: a daily average of 118 percent of float traded from mid-January onward, exceeding 300 percent on peak days, a 14:1 cumulative turnover ratio during the main surge, more shares changing hands than technically existed, repeatedly, for weeks.
Welfare, genuinely contested, not tidy. Community language explicitly framed the trade as punishing hedge funds seen as predatory, Rabin's mutual-min spite equilibrium at market scale. "Diamond hands" against "paper hands" functioned as an identity marker, Akerlof and Kranton's mechanism, where selling stopped being financial and became a defection from a self-concept. Melvin Capital's assets fell from $12.5 billion to roughly $8 billion in a single month before the fund shut down in 2022, a real, quantified loss.
Who captured the corresponding gain doesn't resolve cleanly: some retail traders who sold near the January peak captured real, substantial gains; others, holding on the identity logic that helped drive the squeeze in the first place, continued holding as the price fell back sharply in the following months, converting paper gains into real losses. The same forces that inflicted losses on the funds also, for a meaningful share of the crowd, inflicted losses on the crowd itself.
Systemic: regulatory attention followed the volume, not just the price. The scale of the trading disruption, brokerages restricting purchases mid-squeeze, clearinghouses, the institutions that guarantee every trade actually settles, demanding sharply higher collateral deposits from brokers as volume and volatility spiked simultaneously, drew Congressional hearings and regulatory review in the months after, a direct, institutional acknowledgment that what happened wasn't confined to one stock's price or one fund's losses, but touched the plumbing, collateral requirements, clearing capacity, that the broader market depends on.
When Robinhood restricted purchases, citing exactly those clearinghouse deposit requirements, it was also a real, live breach of the trust extended in Berg, Dickhaut, and McCabe's design, a platform trusted by default, restricting the behavior its users had trusted it to support, at the moment that trust mattered most.
Chapter 7The Limits of Arbitrage: Price, Forced Volume, Precise Welfare Accounting, and a System Nearly Taken Down With It
The mechanism. Andrei Shleifer and Robert Vishny's 1997 paper asks what happens when the arbitrageur needs capital that isn't theirs. If a correct trade's mispricing widens before converging, outside investors judging by short-term performance can force the position closed before the correction arrives. The paper's own illustration: two nearly identical futures contracts, on exchanges in London and Frankfurt, briefly diverge; if the gap widens further, the exchange demands more margin, additional collateral posted to cover the position's growing paper loss before it's proven wrong, and an under-capitalized arbitrageur without that extra cash on hand is forced to unwind at a loss despite the contracts being guaranteed to converge by their own terms.
Where this shows up in practice, across all four dimensions at once. Long-Term Capital Management, founded in 1994 by John Meriwether with Nobel laureates Myron Scholes and Robert Merton on its board, ran convergence trades betting tiny, temporary price gaps between related securities would close. In August and September 1998, following Russia's debt default, those gaps widened instead, and LTCM lost roughly $4.6 billion in under four months.
Volume: the unwind itself moved the market it was trying to exit. LTCM's forced liquidation wasn't a quiet, price-neutral event, selling large, concentrated positions into markets that couldn't absorb them without moving further against LTCM pushed prices in exactly the wrong direction, a self-reinforcing spiral where the act of raising capital by selling made the mispricing worse, precisely the volume-driven feedback loop that separates an orderly unwind from a crisis.
Welfare, precisely: this was not a taxpayer bailout, and that distinction matters. The $3.6 billion rescue was arranged by fourteen banks and financial institutions under Federal Reserve supervision, funded entirely by those private institutions, not public money. The welfare cost fell on LTCM's own investors, who were largely wiped out, and on the consortium banks, who absorbed the recapitalization in exchange for control of the fund's unwind. Getting this precise matters: it distinguishes 1998 from the publicly-funded interventions of 2008, and shows the limits-of-arbitrage mechanism resolving through private capital when the threat was contained early enough.
Systemic: the actual reason the Federal Reserve organized anything at all. LTCM's positions were large and interconnected enough, spread across roughly a dozen major counterparty banks, that a disorderly collapse threatened correlated losses across the broader financial system simultaneously, not just LTCM's own investors. The rescue wasn't about saving one fund, it was about preventing one arbitrageur's capital constraint from cascading into everyone else's, the limits-of-arbitrage model operating at the scale of the entire system rather than one balance sheet.
One more piece from the first article closes here too: LTCM's own positions became genuinely difficult to value, not just risky, once correlations that had held for years broke down together in the crisis, Ellsberg's distinction between risk and ambiguity, showing up at the scale of an entire portfolio.
Chapter 8What Are Informational Cascades? Price, Volume, Welfare, and the Purest Systemic Risk in This Article
The mechanism. Every model so far still assumes each trader is at least trying to use their own information. Sushil Bikhchandani, David Hirshleifer, and Ivo Welch's 1992 paper describes a sequence of investors, each observing prior decisions plus their own private signal, where once enough previous investors have made the same choice, their combined visible decisions carry more weight than any new investor's private signal, and the rational move becomes ignoring your own signal and copying the crowd.
Worked example. A company's true prospects are either strong or weak, each equally likely beforehand. Each investor, in turn, gets one private clue, right two-thirds of the time, wrong one-third, and can also see whether everyone before them bought or sold, though not what their private clues actually were.
Investor 1 gets a "strong" clue and buys, this is public now. Investor 2 also gets a "strong" clue: combined with investor 1's inferred clue, that's two strong signals pointing the same way, and Bayes' rule puts the odds of the company actually being strong at 80 percent, so investor 2 buys too. Investor 3 gets a "weak" clue, the opposite of what the crowd has shown so far. Weighing their own weak clue against two inferred strong ones:
Even holding a private clue that points the other way, investor 3's own honest best estimate is still 67 percent in favor of "strong," because two people's visible actions outweigh one person's private signal. Investor 3 buys, ignoring their own clue entirely, and so does everyone after them, regardless of what their own clues say. That's the cascade starting, not from anyone behaving irrationally, but from the third investor onward correctly recognizing that the crowd now knows more than they do individually, even when, this time, the crowd happened to be wrong.
Quantal response equilibrium, from the second article, is directly relevant: each investor in the cascade is plausibly reasoning with QRE's genuine noise, not perfect precision, and a cascade built from noisy individual decisions is just as capable of locking in a wrong herd as one built from perfect Bayesian updating.
Volume is the cascade's visible signature. A cascade doesn't just move a price, it announces itself through a distinctive volume pattern, a sudden, sustained concentration of trading in one direction, precisely because the mechanism requires enough visible prior action to outweigh any individual's private signal in the first place. Volume isn't incidental to a cascade, it's the input the whole mechanism runs on.
Welfare: the cost falls asymmetrically, on whoever's signal never got consulted. Investors near the front of a cascade who happened to have accurate private information benefit from being right early. Investors deep inside an established cascade bear a real cost if the cascade turns out wrong, having rationally suppressed their own potentially-correct information in favor of copying a crowd that was, this time, mistaken, a welfare loss imposed by rational behavior, not irrational behavior.
Systemic, and this is the purest case in the entire article. Bank runs are informational cascades with no price mechanism buffering them at all. Once enough depositors are seen withdrawing, the rational response for the next depositor is to withdraw too, regardless of the bank's actual solvency, because everyone else's visible action has become more informative than any one depositor's own assessment of the balance sheet. Unlike a mispriced stock, which can sit wrong for months before arbitrage or new information corrects it, a cascading bank run can destroy an otherwise-solvent institution in days, precisely because the cascade and the systemic consequence are, in this case, the same event.
Chapter 9Reputational Herding: Correlated Volume, a Client-Side Welfare Cost, and Career-Driven Systemic Amplification
The mechanism. Informational cascades explain herding as a rational response to information. David Scharfstein and Jeremy Stein's 1990 paper describes a second, mechanistically distinct route: career concerns. A manager evaluated on being right faces an asymmetric penalty, wrong alongside everyone else reads as bad luck; wrong alone reads as a skill failure.
The formal logic.
| Scenario | Reputational Cost of Being Wrong |
|---|---|
| Manager follows consensus, consensus turns out wrong | Low, shared bad luck |
| Manager follows private signal alone, turns out wrong | High, personal misjudgment |
| Manager follows private signal alone, turns out right | Positive, but often smaller than the downside of being wrong alone |
Worked example. Suppose a manager's own research is genuinely good, right 70 percent of the time, while simply following the consensus is no better than a coin flip, since the rest of the crowd is largely herding too, not generating fresh information. Assign illustrative reputational payoffs: right alone is worth +2, wrong alone costs -12, right with the consensus is worth 0 (expected, no special credit), wrong with the consensus costs -3.
Following the consensus comes out ahead, versus , even though it's the less accurate choice, 50 percent right against the manager's own 70 percent. The asymmetry in how being wrong gets punished, alone versus in company, is large enough to make the objectively worse information source the reputationally smarter one to follow.
Worked illustration. Mutual fund herding intensity tracks career pressure closely: funds herd roughly 71 percent more in down markets than up markets, and underperforming funds herd about 110 percent more specifically in down markets, when the career cost of an isolated mistake is highest.
Volume: herding is, definitionally, correlated volume. When many managers converge on the same position for reputational rather than informational reasons, the result is, by construction, many large trades moving in the same direction at the same time, a volume signature distinguishable from ordinary trading precisely because it's driven by shared incentive structure rather than shared genuine information.
Welfare: a principal-agent cost borne by the client, not the manager. The manager's incentive, avoid being wrong alone, and the client's interest, have their capital genuinely well managed, diverge directly under this model. A manager choosing career-safe consensus over a genuinely superior private signal is optimizing for their own reputational risk at the client's expense, a real welfare cost transferred from the person bearing the financial risk to the person merely managing it.
Systemic: this is where individual career incentives become market-wide amplification. Kenneth Froot, David Scharfstein, and Jeremy Stein's 1992 follow-up paper extends the logic directly into short-term speculative trading, showing that when many traders are evaluated on short horizons, it can be individually rational to trade on the same short-term signal everyone else is watching, regardless of long-run fundamentals. At scale, this converts an individual career-protection strategy into a market-wide amplifier, the same reputational logic driving many managers toward the same positions simultaneously, and away from them simultaneously, magnifying exactly the kind of correlated, system-wide swings this article has already shown, in LTCM's forced unwind and in GameStop's volume spike, can turn a contained mispricing into a systemic event.
Chapter 10Conclusion & Key Takeaways
This series opened with a man who lost a bonus he never actually had, and this article closes with a hedge fund that lost billions on a trade that was, in the end, mostly right. This article's job was to make sure nothing built across the first two articles was left merely true about individuals and never shown to matter at scale, and to make sure that scale was measured properly, in price, in volume, in who actually gained and lost, and in what happens when any of the first three gets large enough to threaten the system carrying them.
The disposition effect turned out to be four models converging on the same brokerage data, with a real volume asymmetry between winners and losers and a systemic liquidity consequence in down markets. Overconfidence turned out to have volume as its single most robust effect, not a side note to returns. Momentum turned out to carry its own volume signature, predicting exactly how large and how durable a price pattern would be, with real losers on the other side of every momentum trade's gains. The equity premium puzzle turned out to be a welfare and capital-allocation story at the scale of an entire economy, not just an asset-pricing curiosity.
GameStop turned out to be salience, spite, identity, broken trust, contested welfare, and a volume event so extreme it drew Congressional review, all at once. LTCM turned out to show all four dimensions simultaneously, a forced volume spiral, a precisely-accounted private-sector welfare cost, and a systemic rescue that was never really about one fund. Informational cascades turned out to be the purest systemic case in the piece, a bank run needs no price mechanism at all to destroy an institution. And reputational herding closed the loop, showing how one manager's career-safety calculation becomes, at scale, a market-wide amplifier of exactly the fragility this article spent eight models explaining.
One model never found a natural home in an article built around trading and market mechanics, and it's worth naming honestly rather than dropping silently. Warm-glow altruism, giving that pays out on the act itself regardless of outcome, shows up at real market scale in ESG and impact investing, where documented research has found investors accepting measurably lower expected returns for the act of holding value-aligned assets, a genuine closure that simply belongs here, on its own, rather than forced into a section it doesn't fit.
None of these nineteen models argue markets are hopeless, or that price, volume, welfare, and systemic stability are separate stories. They're the same story, told four ways, and the moments worth paying the closest attention to are the ones where all four align at once, a stock's price detaching from its business, its volume exceeding its own float, its gains and losses landing unevenly on the people who drove the move, and a system built to absorb one fund's mistake instead having to organize a rescue.
Three articles have now covered nineteen formal models, none invented here, each one drawn from a real, published paper, and tested against real brokerage data, real hedge fund collapses, and a real run on a single meme stock. What they haven't done yet is leave the world of finance at all, every case study in this series, deliberately, has been a market, a trade, a portfolio.
The fourth and final article in this series changes that. It steps back from formal models entirely and goes looking for these same nineteen mechanisms operating in industries that have nothing to do with a stock ticker, real, named case studies spanning healthcare, retail, technology, and beyond, each one a place where a reference point, a reciprocal favor, a noise-trader-style overreaction, or a cascade found its way into a decision that had nothing to do with a brokerage account. If the first three articles proved these models are real, the fourth is where they get to prove they're everywhere.
| Takeaway | Why It Matters |
|---|---|
| The disposition effect has a real volume asymmetry, not just a price bias | Winners get sold quickly, losers get frozen, and Grinblatt and Han's capital-gains overhang connects this directly to future momentum |
| Overconfidence's most robust effect is on volume, and its systemic impact depends on who holds it | A market can look roughly price-efficient while burning real value on volume; an overconfident market-maker degrades prices for everyone, not just themselves |
| Momentum has its own volume signature that predicts its strength and duration | Lee and Swaminathan found high-turnover winners reverse faster than low-turnover ones, volume isn't decoration, it's a forecasting variable |
| The equity premium puzzle is a welfare and capital-allocation story at economy scale | Myopic loss aversion doesn't just distort one portfolio, it can tilt an entire economy's capital away from productive risk-bearing |
| GameStop was a price, volume, welfare, and systemic event simultaneously | 118 percent of float traded daily, contested gains and losses inside the same retail community, and Congressional review, not just a mispriced stock |
| LTCM shows all four dimensions and a precise welfare accounting | Forced selling moved the very market it was trying to exit; the $3.6 billion rescue was private capital, not a taxpayer bailout, and it existed to stop systemic contagion |
| Informational cascades are the purest systemic case in this article | A bank run needs no mispricing at all, the cascade and the systemic collapse are the same event |
| Reputational herding turns individual career math into market-wide amplification | Client welfare and manager incentive diverge directly, and at scale that same divergence becomes correlated, system-wide swings |
| Three articles built the models; one more finds them outside finance entirely | Real, named case studies across industries are where this series closes, proving these mechanisms were never just about markets |
Sources
Shefrin, H., & Statman, M. (1985). "The Disposition to Sell Winners Too Early and Ride Losers Too Long." Journal of Finance, 40(3), 777-790; Odean, T. (1998). "Are Investors Reluctant to Realize Their Losses?" Journal of Finance, 53(5), 1775-1798; Grinblatt, M., & Han, B. (2005). "Prospect Theory, Mental Accounting, and Momentum." Journal of Financial Economics, 78(2), 311-339; Odean, T. (1998). "Volume, Volatility, Price, and Profit When All Traders Are Above Average." Journal of Finance, 53(6), 1887-1934; Statman, M., Thorley, S., & Vorkink, K. (2006). "Investor Overconfidence and Trading Volume." Review of Financial Studies, 19(4), 1531-1565; Barber, B. M., & Odean, T. (2001). "Boys Will Be Boys: Gender, Overconfidence, and Common Stock Investment." Quarterly Journal of Economics, 116(1), 261-292; Daniel, K., Hirshleifer, D., & Subrahmanyam, A. (1998). "Investor Psychology and Security Market Under- and Overreactions." Journal of Finance, 53(6), 1839-1885; Barberis, N., Shleifer, A., & Vishny, R. (1998). "A Model of Investor Sentiment." Journal of Financial Economics, 49(3), 307-343; Lee, C. M. C., & Swaminathan, B. (2000). "Price Momentum and Trading Volume." Journal of Finance, 55(5), 2017-2069; Mehra, R., & Prescott, E. C. (1985). "The Equity Premium: A Puzzle." Journal of Monetary Economics, 15(2), 145-161; Benartzi, S., & Thaler, R. H. (1995). "Myopic Loss Aversion and the Equity Premium Puzzle." Quarterly Journal of Economics, 110(1), 73-92; De Long, J. B., Shleifer, A., Summers, L. H., & Waldmann, R. J. (1990). "Noise Trader Risk in Financial Markets." Journal of Political Economy, 98(4), 703-738; Shleifer, A., & Vishny, R. W. (1997). "The Limits of Arbitrage." Journal of Finance, 52(1), 35-55; Bikhchandani, S., Hirshleifer, D., & Welch, I. (1992). "A Theory of Fads, Fashion, Custom, and Cultural Change as Informational Cascades." Journal of Political Economy, 100(5), 992-1026; Scharfstein, D. S., & Stein, J. C. (1990). "Herd Behavior and Investment." American Economic Review, 80(3), 465-479; Froot, K. A., Scharfstein, D. S., & Stein, J. C. (1992). "Herd on the Street: Informational Inefficiencies in a Market with Short-Term Speculation." Journal of Finance, 47(4), 1461-1484