India runs its economy through a handful of cities, and those cities barely move. In the latest TomTom Traffic Index (2025 data, published January 2026), Bengaluru ranked as the second most congested city in the world, and the Economic Survey 2025-26 estimates that Delhi, Mumbai, Bengaluru and Kolkata together lose about Rs 1.47 lakh crore every year to delayed travel, wasted fuel and lost productivity. Cities generate nearly 60% of India's GDP on roughly 3% of its land, so congestion in a few metros is not a local nuisance - it functions like a tax on the whole economy, collected daily in time, fuel and fatigue.
Chapter 1How slow are Indian cities, really?
By the TomTom Traffic Index, Bengaluru's city centre averaged 3 minutes 37 seconds to cover one kilometre in 2025 - roughly 16.6 km/h - making it the third slowest city centre measured worldwide, behind only Barranquilla in Colombia (3:40) and London (3:38). By congestion level, which measures how much traffic slows a network below its free-flow speed, Bengaluru's 74.4% was second in the world, behind only Mexico City.
The picture across India's major cities, from the same index:
| City | Congestion level (2025) | Change vs 2024 | Hours lost per year in rush hour |
|---|---|---|---|
| Bengaluru | 74.4% | +1.7 pp | 168 |
| Pune | 71.1% | +5.4 pp | 152 |
| Mumbai | 63.2% | -3.3 pp | 126 |
| New Delhi | 60.2% | +3.5 pp | 104 |
| Kolkata | 58.9% | +0.3 pp | 150 |
| Chennai | 58.6% | +0.1 pp | 132 |
| Hyderabad | 55.5% | -1.3 pp | 123 |
| Ahmedabad | 49.0% | -3.8 pp | 106 |
Two details stand out. First, the direction: of the nearly 500 cities TomTom studied in 2025, only 34 saw travel times improve, and most Indian metros got worse - Pune deteriorated fastest, adding 5.4 percentage points in a single year. Second, the rush-hour reality: a Bengaluru driver covers about 3.5 km in 15 minutes at peak - a speed of 14 km/h, which a fit cyclist can match. Mumbai's wider metro area ranked as the third most congested metro region in the world.
Chapter 2How much money does traffic cost India every year?
The Economic Survey 2025-26, released in January 2026, puts the annual loss from congestion in just four metros - Delhi, Mumbai, Bengaluru and Kolkata - at about Rs 1.47 lakh crore, counting delayed travel, wasted fuel and reduced workforce productivity. An earlier BCG study commissioned by Uber (2018) estimated the same four cities lost $22 billion a year, and found peak-hour congestion of 149% against an Asian average of 67%.
The Survey also breaks the cost down to individuals: an unskilled worker in Delhi can lose Rs 7,200 to Rs 19,600 a year to congestion, and a skilled worker up to Rs 25,900 - money lost to fuel, missed work hours and slower job access.
Why does congestion make a whole economy poorer?
Because cities create wealth through speed of connection, and congestion attacks exactly that. Economists call it agglomeration: cities are matching machines that connect workers to the jobs, ideas and customers that suit them best, and the bigger the pool each person can reach, the more productive everyone becomes.
Congestion shrinks that pool. The arithmetic is stark. A worker willing to commute 45 minutes can reach jobs within about 10.5 km at Bengaluru's 14 km/h rush-hour speed. At 30 km/h, the same 45 minutes covers 22.5 km. Since the area of a circle grows with the square of its radius, doubling the speed roughly quadruples the reachable job market (this is worked arithmetic, illustrative rather than a measured statistic). Slow traffic quietly converts a megacity of 12 million into several disconnected towns - workers take nearer jobs instead of better ones, firms pick from smaller talent pools, and the matching engine that justifies big-city rents runs at a fraction of its capacity.
The same friction taxes innovation. New ideas spread through meetings, job switches and chance collisions between people - all of which happen less when crossing the city costs two hours. And it taxes logistics: every delivery van crawling at 14 km/h needs more vehicles, more drivers and more fuel to move the same goods, costs that flow into the price of nearly everything.
Chapter 4What does the daily commute do to productivity and health?
It consumes the two resources no one can buy back: time and energy. Commute research by MoveInSync found Indian office workers spending around two hours a day travelling to and from work - about 7% of their day - and a 2019 survey reported 92% of Indians found their commute uncomfortable, with noise, honking and pollution the leading complaints.
The time has to come from somewhere. Bengaluru's 168 rush-hour hours lost per year equal 21 full eight-hour working days - a full month of workdays spent stationary in traffic. For most people that month is paid for out of sleep, exercise, family time and learning, which is precisely the budget that fuels next year's productivity. Long commutes are consistently associated in health research with higher stress, shorter sleep and lower life satisfaction; a tired workforce produces less per hour even after it reaches the office.
What is the personal money math of a long commute?
Time in traffic has a price even when no cash leaves your pocket. As a purely illustrative example: a professional earning Rs 6 lakh a year for roughly 2,000 working hours values their time at about Rs 300 an hour. At that rate, Bengaluru's 168 lost hours are worth about Rs 50,400 a year - before counting the extra fuel burned idling, faster vehicle wear, and the salary growth foregone by picking a nearer job over a better one. This is why commute length belongs in the same spreadsheet as rent when comparing neighbourhoods or offers - a trade-off explored in money decisions when relocating cities and geographic arbitrage within India.
Chapter 6Can anything fix it?
The Economic Survey 2025-26 recommends congestion pricing in dense business districts - charging vehicles for entering the most clogged zones at peak times - alongside parking reforms, arguing that demand-based pricing shifts trips to public transport and spreads traffic across the day. The global evidence is instructive but sobering: New York introduced a congestion charge in 2025 and TomTom's data showed congestion falling in the first half of the year, before creeping back up in the second half. Pricing, transit capacity and land-use planning appear to work only as a package; no city has escaped congestion by building roads alone. TomTom's own analysis notes that even Los Angeles, where over 60% of central roads are highways, remains heavily congested.
There are small signs of movement in the Indian data too: Mumbai, Hyderabad and Ahmedabad all recorded lower congestion levels in 2025 than in 2024, even as Bengaluru, Pune and Delhi worsened.
Chapter 7What this means for you
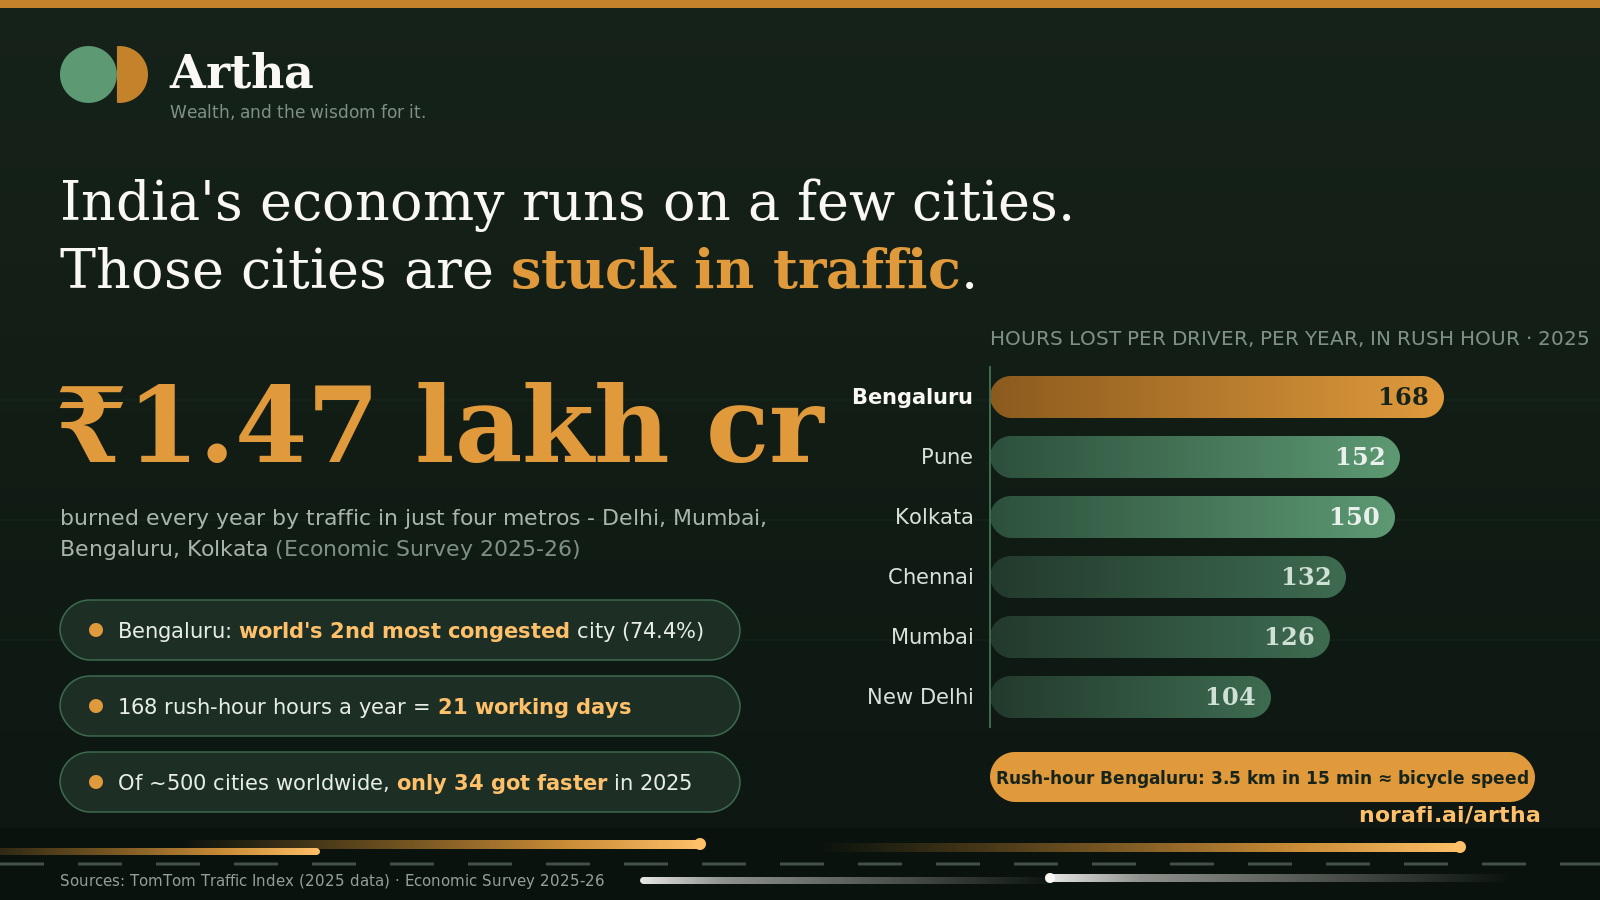
India's growth story is written in a handful of cities that are among the slowest on earth, and the meter is running: about Rs 1.47 lakh crore a year in the four biggest metros alone, a month of workdays lost per commuter in Bengaluru, and a job market that congestion quietly shrinks for everyone in it. Understanding congestion as a tax - one paid in time, fuel, sleep and narrowed opportunity - explains both why economists take it so seriously and why commute math deserves a permanent line in your own financial thinking.